

Dr. Hector Carlos Autino Editorial Director of the Technical Publication of ASAGA «A&G»
SEED OIL AND CEREAL SECTORS ACCOUNTED FOR 44% OF ARGENTINIAN EXPORTS IN THE YEAR 2019
Article written with the collaboration of the Rosario Stock Exchange
According to INDEC, in 2019 Argentina exported 65.115 billion dollars. Of the total, 29% was generated by the seed oil sector and 15% by the cereal market. The key to this was the productive recovery after the worst drought in 50 years.
The 2018/19 agricultural season was characterized by a very important production reco-very after Argentina went through the worst drought in half a century in the 2017/18 cycle. In this year, grain production reached a historic record of 142 million tons produced, exceeding what had been harvested in the previous campaign by 46%.
This favorable context, driven by a climatic improvement, added to the well-thought out planting work of the producers, and ultimately led to the oil seed and cereal industry being the two most dynamic sectors of the Argentine economy on the external front, amounting to an income of foreign exchange close to $29 billion. This amounted to 44% of all the country’s exports, according to data from the INDEC (See Figure 1).
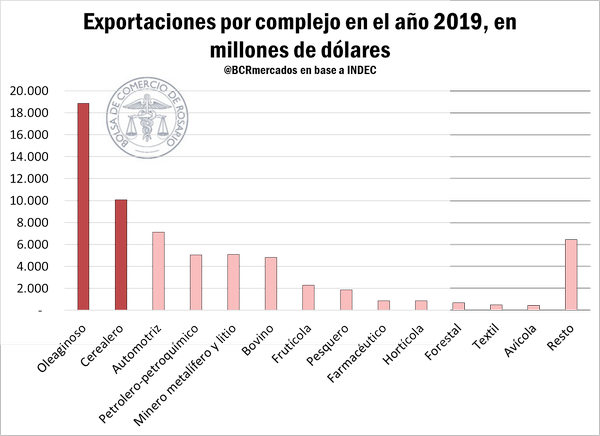
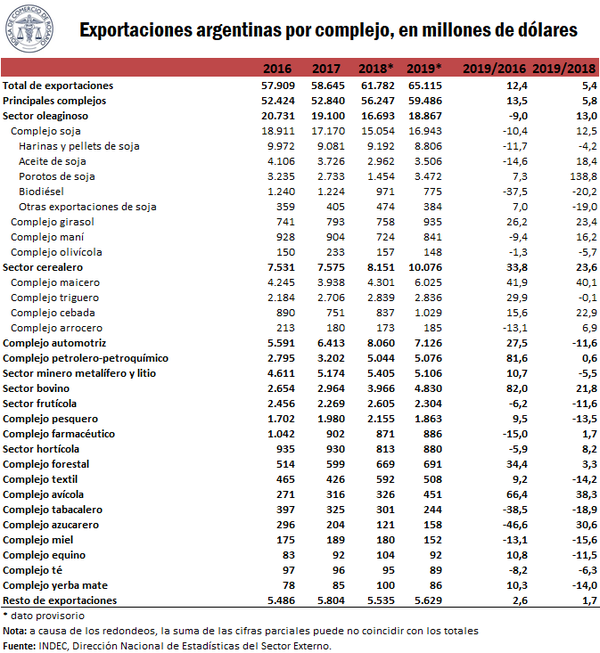
In total, the Argentine Republic exported 65,115 million dollars in 2019, showing an improvement of 5.4% from the previous year. The other industries that followed in importance to the two previously mentioned ones were the automotive (USD 7,126 m), petroleum-petrochemical (USD 5,076 m), mining metalliferous and lithium (USD 5,106 m), bovine (USD 4. 830 m), fruit (USD 2,304 m), fishing (USD 1,863 m), pharmaceuticals (USD 886 m), horticulture (USD 880 m), forestry (USD 691 m), textiles (USD 508 m), poultry (USD 451 m) and others (USD 6,450 m).
Next, we will proceed to analyze the composition of the exports in the most significant industries according to the total value of the firms.
Oil seed sector
It was, by and large, the sector that attributed the highest amount of money to the country, reaching 18,867 million USD, 29% of the total exported. Among the companies in the market, 89.8% of the oil seed production came from the soy market, 5.0% from the sunflower market, 4.5% from the peanut market, and 0.8% from olive growing. Among the main recipients of this sector, there is the European Union, ASEAN, China, India, «Maghreb and Egypt » iii and The Middle East iv.
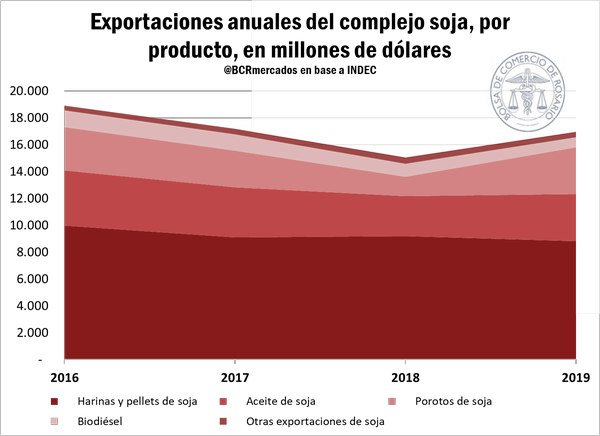
The soybean market’s exports were at USD 16.943 billion, increasing by 12.5% since the previous year, and was very close to the average of the last three years. 52% of the firms in this market corresponded to flour and soybean pellets, and they experienced a year-on-year decline of 4.2%. Meanwhile, 21% of the soybean market exports can be explained by the oil market, whose exports were 18% more than those of 2018. The soybean firms, while they represented the 5.3% of the shipments of this market, were the ones that gained the most participation compared to the previous year, rising 139% in relation to 2018. Bio diesel represented the 1.2% of shipments abroad (with a drop 20.2%) and the remaining 0.6% was due to other exports, such as glycerol, lecithin and waste (which fell by 19% inter-annually).
Within this market, the main recipients of soybean flour and pellets were ASEAN, (USD 3,186 M), European Union (USD 2,425 M), the Middle East (USD 971 M) and «Maghreb and Egyptian to» (USD 696 M). Regarding soybean oil, its main buyers were India (USD 1,639 M), «Maghreb and Egypt» (USD 507 M),»Rest of ALADI » (USD 313 M) and China (USD 165 M). On the side of the soybean, its largest markets were China (USD 3.013 billion) and «Maghreb and Egypt» (USD 217 M). Finally, the main biodiesel destination was the European Union (USD 755 M) (See Figure 2).
For its part, the sunflower market registered 935 million dollars in firms in 2019, increasing by 23.4% in comparison with the previous year. Of this amount, 73.4% corresponds to sunflower oil, 17.6% to flours and pellets and 9.0% remaining to seeds.
The main destinations of the sunflower sector were the European Union (USD 181 M), the Middle East (USD 151 M) and India (USD 132 M).
The other two markets that make up the oil seed market are the peanut market, which exported 841 million (16.2% of the total) to the United States, and the olive market, which exported 148 million (falling by 5.7%).
Cereal sector
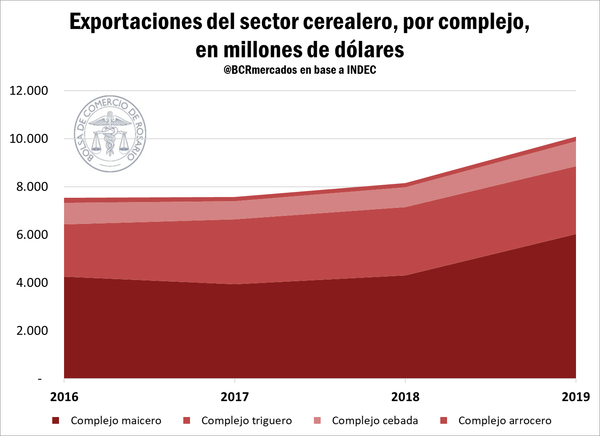
Exports from this sector experienced an increase of 23.6% since the previous year, reaching an amount of USD 10,076 million. 59.8% of the total can be attributed to the corn market; 28.1% to the wheat market; 10.2% for the barley market and 1.8% to the rice market.
Among the main markets of the sector there is ASEAN, Mercosurvi, «Maghreb and Egypt», «Rest of ALADI» and the Middle East.
As for the first of these markets, the The corn market, their firms totaled 6.025 billion dollars in 2019, registering an increase of 40.1% year-on-year. 99% of the exports of this cereal were made in grains, while the remaining 1% corresponds mainly to oil and cornstarch.
The largest export destinations of the corn market were ASEAN (USD 1.743 billion) – where a great participation can be seen from Vietnam, «Maghreb and Egypt» (USD 1.338 billion), «Rest of ALADI» (USD 756 M), the Middle East (USD 672 M), the Republic of Korea (USD 561 M) and Chile (USD 342 M).
Meanwhile, the wheat market accounted for a foreign currency income of USD 2.836 billion, showing a slight year-on-year decrease of 0.1%. In this case, 86.4% corresponded to wheat and 13.6% to its products (flour, bran, bread and cookies).
Among the most important buyers of this market there is Mercosur (USD 1.346 billion) – with a very marked predominance in Brazil, which represented 95.8%, ASEAN (USD 598 M), «Rest of ALADI» (USD 218 M) and Chile (USD 135 M).
Exports of the barley market totaled USD 1,029 million, increasing by 22.9% year-on-year. 70.0% can be attributed to barley (including brewing), 27.6% to malt, and 2.4% to beer.
Finally, the rice market totalled 185 million dollars exported in 2019, increasing by 6.9% in one year (See Figure 3).
Other sectors
Exports from the automotive market totaled USD 7.126 billion in 2019, a decrease of 11.6% with respect to the previous year. 56.2% is attributed to vehicles for transportation of goods; 23.1% to vehicles for transporting people; and the 20.6% to iron and steel, parts and tires.
The metalliferous mining sector firms reached a value of USD 5.016 billion, increasing by 8% year-on-year. Within this sector, 55.6% of exports were gold and silver; 22.0% of the market
steel; 16.0% aluminum; 3.6% lithium; 1.9% lead and 0.9% other metal ores (including copper market). The petroleum-petrochemical market recorded exports of 5.076 billion dollars
in 2019, increasing by 0.6% year-on-year. 84.9% of these corresponded to oil and gas, while 15.1% belonged to petrochemical products.
Exports from the bovine sector are at USD 4.830 billion, an increase of 21.8% year-on-year. 83.5% corresponded with meat and leather, and 16.5% to the dairy market. The poultry market, on the other hand, added firms for a value of USD 451 million in 2019, achieving a 38.3% annual increase.
Meat and waste accounted for 92.0% of the total, while the rest was exported to the United States in the form of eggs, live animals and other poultry exports. Meat was the product that performs the best among this great universe of markets, registering the best interannual rises in the total exported.
Fruit sector shipments, valued in dollars, reached USD 2.304 billion in 2019, falling 11.6% compared to 2018. Of the exports, 44.5% corresponded to the grape market; 24.5% to the lemon market; 15.6% to pears and apples; 4.2% to blueberries and similar fruits; 3.9% to the citrus fruits (excluding lemon); and 7.3% to others.
The fishing market firms totalled 1.863 billion, a decrease of 13.5% year-on-year. The relative shares within this sector were: 71.3% crustaceans and molluscs; 27.3% fresh and frozen fish; and 1.4% flours and preserves.
In 2019, exports from the pharmaceutical market totaled 886 million dollars, increasing by 1.7% since the previous year. Of these, 61.4% corresponded to medicines, and the remaining 38.6% to other pharmaceutical products.
The horticultural sector registered exports of 880 million in 2019, increasing by 8.2% year-on-year. The bean market accounted for 43.6% of the total; the potato market for 26.1%; the garlic market for 15.0%; the chickpea market for 5.7%; and others for 9.7% (mainly onions, peas and vegetable seeds).
Shipments from the forest market reached a value of USD 691 million in 2019, a rise of 3.3% compared to 2018. 53.8% of the exports corresponded to cellulosic-paper products; 25.6% to the wood sector; and the remaining 20.4% to other forest exports (mostly extracts from quebracho).
In 2019, the textile market’s exports amounted to USD 508 million, a decrease of 14.2% compared to the previous year. Of the total, products derived from wool represented 48.2%, those derived from cotton 28.0%, and those corresponding to other textile exports (yarns and fabrics), 24.0%.
The rest of the sectors (adding the tobacco, sugar, honey, equine, tea, yerba mate and other exports markets), together, added exports worth USD 6.450 million in 2019, increasing by 0.2% year-on-year.
The above data are summarized in Table 1.
i European Union (EU): Germany, Austria, Belgium, Bulgaria, Cyprus, Croatia, Denmark, Slovakia, Slovenia, Spain (including Canary Islands), Estonia, Finland, France, Greece, Hungary, Ireland, Italy, Latvia, Lithuania, Luxembourg, Malta, Netherlands, Poland, Portugal, United Kingdom of Great Britain and Northern Ireland (member until January 31, 2010) (2020), Czech Republic, Romania and Sweden.
ii Association of Southeast Asian Nations (ASEAN): Brunei, Cambodia, Indonesia, Philippines, Laos, Malaysia, Myanmar, Singapore, Thailand and VietNam.
iii Egypt and the Arab Maghreb Union: Algeria, Libya, Morocco, Mauritania and Tunisia.
iv Middle East: Saudi Arabia, Bahrain, United Arab Emirates, Iran, Iraq, Israel, Jordan, Kuwait, Lebanon, Oman, Qatar, Yemen, Syria and Palestine.
v Resto de la Aso-Latin American Integration (Rest of ALADI): Bolivia, Colombia, Cuba, Ecuador, Peru and free zones.
vi Southern Common Market (Mercosur): Argentina, Brasil, Paraguay, Uruguay, Venezuela and free zones.